Wi-Fi CSI in Python: parsing, grouping, phase cleaning and motion metrics
By Wu Jun · Updated 2026-10-29 · 7 min read
Getting CSI is only step one. A trustworthy result depends on four operations: parse, group measurements, clean and extract features. This walkthrough uses the public 10-minute dataset and checks matrix shape, duration and independent measurement rate.
The raw capture [1], 10-second sample [2] and runnable analysis scripts [3] are downloadable. The code below needs NumPy; plotting also needs Matplotlib.
1. Know which "record" you are counting
The capture has two layers:
| Layer | Layout |
|---|---|
| outer record | double file_ts + uint16 length + payload, little endian |
| inner CSI | 24-byte v1 or 28-byte v2 header followed by interleaved int16 I/Q |
The v1 header is:
uint32 ts
6 bytes ta
int8 rssi
int8 snr
uint8 bw
uint8 ch
uint8 mode
uint8 pad_or_seq_epoch
uint16 data_num
uint16 tx
uint16 rx
uint16 chain_info
v2 appends uint32 sequence, so its I/Q offset is 28. The public 10-minute data uses v1, but a parser should
detect both formats or a firmware update can shift the data silently.
2. Parse and group one real measurement
A measurement may contain four or eight chain records that share almost the same instant. chain_info bit 15
marks the final chain. Do not treat each chain as a new time sample.
import struct
from collections import Counter

import numpy as np

REC = struct.Struct("<dH")
HDR = struct.Struct("<I6sbBBBBBHHHH")

def iq_offset(payload, n):
    # v2: 24-byte v1 header + uint32 sequence + n complex int16 pairs
    if n and len(payload) >= 28 + n * 4:
        return 28
    return HDR.size

def load_measurements(path, subcarriers=256):
    records = 0
    groups = []
    pending = []

    with open(path, "rb") as f:
        while True:
            head = f.read(REC.size)
            if not head:
                break
            if len(head) != REC.size:
                raise EOFError("truncated outer record")

            file_ts, length = REC.unpack(head)
            payload = f.read(length)
            if len(payload) != length or length < HDR.size:
                raise EOFError("truncated CSI payload")

            ts, ta, rssi, snr, bw, ch, mode, pad, n, tx, rx, chain = (
                HDR.unpack_from(payload)
            )
            offset = iq_offset(payload, n)
            iq = np.frombuffer(payload, dtype="<i2", count=n * 2, offset=offset)
            if iq.size != n * 2:
                raise ValueError("I/Q length does not match data_num")

            item = {
                "file_ts": file_ts, "ts": ts, "ta": ta, "n": n,
                "tx": tx, "rx": rx, "chain": chain,
                "csi": iq[0::2].astype(float) + 1j * iq[1::2].astype(float),
            }
            records += 1
            pending.append(item)
            if chain & 0x8000:
                groups.append(pending)
                pending = []

    if pending:
        print("warning: incomplete tail records:", len(pending))
    print("records:", records)
    print("complete measurement groups:", len(groups))
    print("chains per group:", Counter(map(len, groups)))
    return groups
For the public 10-minute capture, expect:
records: 57293
complete measurement groups: 7609
chains per group: Counter({8: 6714, 4: 895})
warning: incomplete tail records: 1
7609 is not 57293 / 8 = 7162. Real data includes four-chain groups and an unclosed tail record.
3. Select one valid complex CSI row per measurement
Not every GL-MT6000 chain carries equally useful data; the bit-15 record can be all zero. The rule below prefers a valid 256-subcarrier tx0/rx0 row, otherwise the valid row with the largest mean amplitude.
def select_valid_chain(group, subcarriers=256):
    candidates = []
    for item in group:
        if item["n"] != subcarriers:
            continue
        if not np.any(np.abs(item["csi"])):
            continue
        candidates.append(item)

    if not candidates:
        return None

    preferred = next(
        (x for x in candidates if (x["tx"], x["rx"]) == (0, 0)),
        None,
    )
    return preferred or max(
        candidates,
        key=lambda x: float(np.mean(np.abs(x["csi"]))),
    )

groups = load_measurements("csi_10m.bin")
selected = [x for group in groups if (x := select_valid_chain(group)) is not None]

t = np.asarray([x["file_ts"] for x in selected], dtype=float)
order = np.argsort(t)
t = t[order] - t[0]
C = np.vstack([selected[i]["csi"] for i in order])
H = np.abs(C)

assert H.shape[1] == 256
assert np.isfinite(H).all()
print("selected shape:", H.shape)
print("duration:", t[-1], "s")
print("independent rate:", len(t) / t[-1], "Hz")
The simple selector produces roughly a 7,608 x 256 matrix over 599.92 s, or about 12.68 independent measurements/s. The full analysis script removes another 25 zero-heavy groups and uses 7,583 measurements.
C keeps complex CSI for phase work. Drop it if only amplitude is needed.
4. Phase cleaning has two dimensions
Raw CSI phase contains propagation phase plus carrier/sampling offsets, hardware offsets and link changes. Calling
np.unwrap once does not mean the phase is calibrated.
4.1 Across subcarriers: remove the linear slope
Within one measurement, a linear phase slope across subcarriers is often related to timing offset. Removing it can help motion/respiration features, but discards real delay information and must not be used for absolute ranging:
def remove_subcarrier_slope(csi_row):
    phase = np.unwrap(np.angle(csi_row))
    idx = np.arange(len(phase), dtype=float)
    slope, intercept = np.polyfit(idx, phase, 1)
    return phase - (slope * idx + intercept)

phase_matrix = np.vstack([remove_subcarrier_slope(row) for row in C])
4.2 Across time: remove slow drift
Each subcarrier can still drift over time. After timestamp resampling, subtract a moving median or smoothed baseline:
def detrend_time_window(x, seconds=30.0, fs=20.0):
    width = max(3, int(seconds * fs))
    if width % 2 == 0:
        width += 1
    pad = width // 2
    padded = np.pad(x, pad, mode="reflect")
    baseline = np.array([
        np.median(padded[i:i + width]) for i in range(len(x))
    ])
    return x - baseline
4.3 Two-antenna CSI ratio
If two stable chains exist in the same measurement, a complex ratio often suppresses common-mode noise better than one raw phase:
def csi_ratio(csi_a, csi_b, eps=1e-12):
    # a / b = a * conj(b) / |b|^2
    return csi_a * np.conj(csi_b) / (np.abs(csi_b) ** 2 + eps)
Validate the ratio on empty-room, still-person and motion data. Do not assume the equation improves every link.
5. Timestamp resampling and a real one-second motion metric
Measurement gaps are not constant. Sort by file_ts, then interpolate onto a uniform grid. Interpolation regularises
time; it does not add information:
FS = 20.0
tu = np.arange(0.0, t[-1], 1.0 / FS)
Hu = np.column_stack([
    np.interp(tu, t, H[:, i]) for i in range(H.shape[1])
])

delta = np.abs(np.diff(Hu, axis=0)).mean(axis=1)
window = int(FS)
motion = np.convolve(delta, np.ones(window) / window, mode="valid")
motion_t = tu[1 + window // 2: 1 + window // 2 + len(motion)]

print("uniform matrix:", Hu.shape)
print("motion points:", len(motion))
This value is the mean amplitude change between resampled snapshots, smoothed over one second:
- a cheap activity baseline;
- not Doppler velocity;
- not enough for fall or respiration diagnosis;
- thresholds must be calibrated on empty, still, walking and motion data.
6. Plot the heatmap and motion trace
import matplotlib.pyplot as plt

fig, ax = plt.subplots(2, 1, figsize=(12, 7), sharex=True)
image = ax[0].imshow(
    H.T, aspect="auto", origin="lower", cmap="viridis",
    extent=[t[0], t[-1], 0, H.shape[1]],
)
ax[0].set_ylabel("subcarrier")
ax[0].set_title("GL-MT6000 CSI amplitude")
fig.colorbar(image, ax=ax[0], label="amplitude")

ax[1].plot(motion_t, motion)
ax[1].set_xlabel("time (s)")
ax[1].set_ylabel("1-second mean |Δamplitude|")
plt.tight_layout()
plt.savefig("csi_dashboard.png", dpi=150)
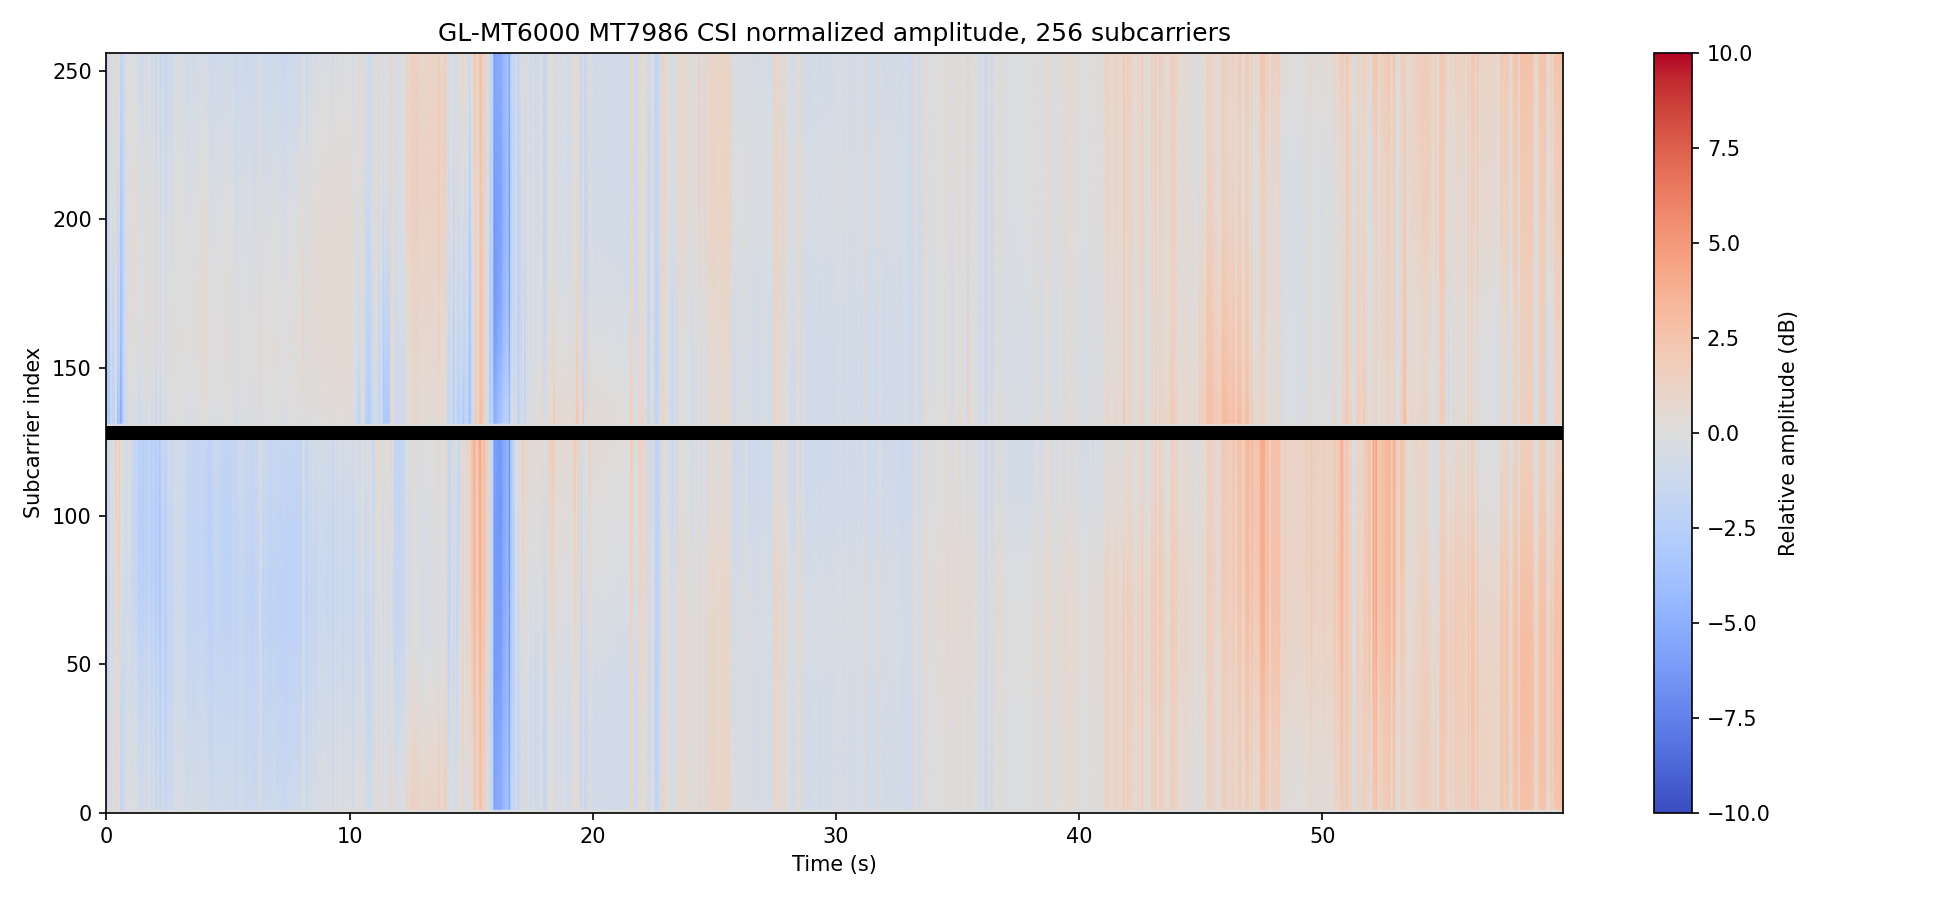
The heatmap checks data shape and temporal stability. It does not establish classifier accuracy.
7. Validation checklist
| Check | Expected for the 10-minute data |
|---|---|
| outer records | 57,293 |
| complete bit-15 groups | 7,609 |
| group sizes | 6,714 eight-chain, 895 four-chain, one tail record |
| matrix after simple selection | about 7,608 x 256 |
| measurements after anomaly filter | 7,583 |
| duration | about 599.92 s |
| independent rate | about 12.64-12.68 Hz |
| whole-file SHA-256 | matches the manifest |
If any value differs, check part order, 24/28-byte offsets, endianness, bit 15 and partial tail records first.
8. Memory and performance
| Data | Approximate memory |
|---|---|
| raw file | about 58 MB |
| 7,600 x 256 float64 amplitude | about 15.6 MB |
| one complex chain | about 31 MB |
| all eight complex chains | about 250 MB |
| 20 Hz interpolated amplitude | about 49 MB |
For longer captures, stream to disk or process one session at a time. Record data_num, time span, maximum gap and
link quality before touching an algorithm.
9. Common traps
| Trap | Symptom | Fix |
|---|---|---|
| treating chains as time samples | inflated rate and aliasing | group on bit 15 and select one chain per measurement |
| averaging raw phase | chain offsets cancel the signal | subcarrier/time calibration or CSI ratio |
| using record index as time | fake spectral peaks | sort and resample on file_ts |
| calling motion a Doppler metric | a peak exists but has no velocity meaning | label it amplitude change, not velocity |
| public-Internet throughput testing | ISP variation contaminates Wi-Fi data | use controlled LAN traffic |
| saving only processed features | parser bugs cannot be reproduced | retain raw bin, script version and summary |
10. Downloadable implementation and next steps
- Router CSI Toolkit v0.1.3 contains
analyze_csi_capture.pyand capture tools; - tool page and SHA-256;
- parts and heatmap: dataset parsing walkthrough;
- vital signs: respiration/heart-rate pipeline;
- multi-format parsing: CSIKit [4], csiread [5] and the SenseFi benchmark [6].
Do not jump to deep learning. First verify matrix shape, timeline, gaps, chain selection and the activity baseline.
References and data sources
Every external claim carries a source and an evidence grade (grading scheme). Grade E marks first-party, reproducible measurements from this project.
- Grade E · first-party measurement
This project's 10-minute raw capture (57,293 records / 600.0 s, SHA-256 00373f83…95e2)
Router CSI Lab · 2026
okwujun.pw/en/datasets/ · verified: Reassembled chunks verified byte-identical (2026-10-11) · The local raw master has SHA-256 00373f83…95e2; the public de-identified derivative has SHA-256 527466ce…a440. They must not be confused. - Grade E · first-party measurement
Router CSI Lab — GL-MT6000 (MT7986) Wi-Fi CSI dataset, 10 s sample + 10 min capture
Router CSI Lab · 2026
doi:10.5281/zenodo.23434789 · verified: CC BY 4.0; SHA-256 published; Zenodo DOI 10.5281/zenodo.23434789 · The dataset has a Zenodo DOI (10.5281/zenodo.23434789) and can be cited directly. - Grade E · first-party measurement
Router CSI Toolkit — capture/analysis/watchdog scripts (MIT, public repository)
Router CSI Lab · 2026
github.com/jjjwu/router-csi-toolkit · verified: GitHub API verified the public repository, capture-quality preflight, successful CI and the v0.1.3 release on 2026-11-02; the archive SHA-256 is 59f144c0…adea7 · The public repository includes a dependency-free capture preflight; the browser checker uses the same container definition and evidence boundaries. - Grade C · official docs
Gi-z/CSIKit — Python CSI parsing and visualisation
G. Zhang
github.com/Gi-z/CSIKit · verified: GitHub API 2026-10-11 (stars 307, MIT, last push 2025-02-19) · Parses many formats: Atheros / Intel / Nexmon / ESP32 / FeitCSI / PicoScenes. - Grade C · official docs
citysu/csiread — fast Cython CSI parser
S. Zhu
github.com/citysu/csiread · verified: GitHub API 2026-10-11 (stars 142, MIT, last push 2024-10-12) - Grade C · official docs
xyanchen/WiFi-CSI-Sensing-Benchmark (SenseFi) — deep-learning benchmark
X. Chen, et al.
github.com/xyanchen/WiFi-CSI-Sensing-Benchmark · verified: GitHub API 2026-10-11 (stars 638, MIT, last push 2023-11-06)